

I have been playing around with a data visualization tool called TouchGraph. The TouchGraph Google Browser reveals the network of connectivity between websites, as reported by Google’s database of related sites.
Here’s a visualization between EncoreOpus.com and others via Google.
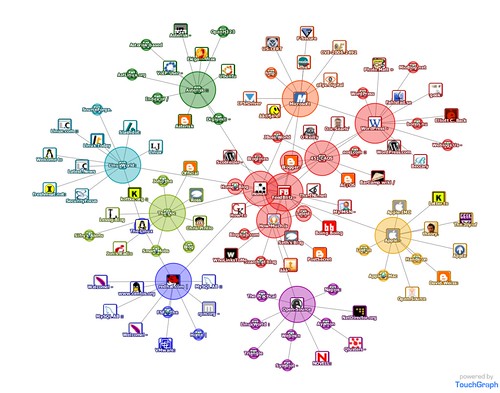
This is an interesting view of how your website has relationships with others through Google search. I am still trying to figure out how this i useful other than it draws really pretty pictures. I am currently reading Linked and am fascinated by graph theory, networks and all that entails. Perhaps this chart is useful but I am still figuring out how. Maybe I’ll figure it out when I make it the last chapter.
For more of Mark Hinkle, visit his EncoreOpus blog.